Classical Retail Trading Vs Smart Money Concepts Battle for Superiority (Part 2)
Smart Money Concepts
Now, we get to look at smart money concepts and, in this article, I would like to talk about the following
A look into smart money concepts:
- Their concepts and methodology.
- Examples of successful Smart money veterans and their work
The year 2016 began the reign of a new way of viewing the markets this was said to be a way that supersedes all ways. This concept is said to follow closely the behavior of the market and have predictive ability that triumphs over retail trading.
The famous concept of liquidity was popularized by this concept of trading, it is believed that there are areas of liquidity in the market where the market tends to gear towards, and the entire engineering of this concept believes that the market moves based on this liquidity level.
Because it is a new form of trading most of the influential figures behind these concepts are still alive, if not all of them. For this discussion, I will just mention a few of them who I believe have impacted this industry and have riled up a massive following, individuals such as:
- Phantom Fx (Supply and Demand).
- Inner Circle Trader (I.C.T).
Quick history:
- Phantom Fx (Supply and Demand)

Although Phantom Fx did not invent the concept of supply and demand, they made it popular. They are a group of experienced traders who inspire a large community of traders and teach them their concepts and ways in which they see the market.
- Supply and Demand Concept
The concept like I said earlier was not invented by Phantom Fx but they gave their twist to it refining it to accommodate for risk and optimize reward.
First, the concept of supply and demand before the intervention of phantom Fx was divided into essential patterns namely:
- Rally Base Rally
- Rally Base Drop
- Drop Base Drop
- Drop Base Rally
Rally Base rally

This is a pattern that has a price in an uptrend and then a base forms in the middle of the trend and is followed by another rally. It is believed that if the price in the future comes back to that base zone it should react and move to the upside.
Rally Base Drop

This is a reversal pattern that states that if previously the price was in an up-trend, that is a rally and a base is formed followed by a drop in price, this is a tell-tell sign that the price has reversed the uptrend, and if the price was to make its way back to the base such is to be treated with a bearish bias.
Drop Base Drop

This is a pattern that has the price in a downtrend and then a base forms in the middle of the trend followed by another drop. It is believed that if the price in the future comes back to that base zone it should react and move to the downside.
Drop Base Rally

This is a reversal pattern that states that if previously the price was in a down-trend, that is a drop and a base formed followed by a rally in price, this is a tell-tell sign that the price has reversed the downtrend and if the price was to make its way back to the base such is to be treated with a bullish bias.
This was the origin of Supply and demand before Phantom FX brought their special twist.
To this, they were of the thought that certain moves occur in the market which are made by Whales example: Banks, Hedge Funds, and Large Corporations. These moves keep recurring when the price touches the zone in which they suspect the move originated.
Phantom Fx (Supply and Demand Concept) 

They popularized the term supply and demand zones which are areas in the market where institutional-sponsored moves are originated.
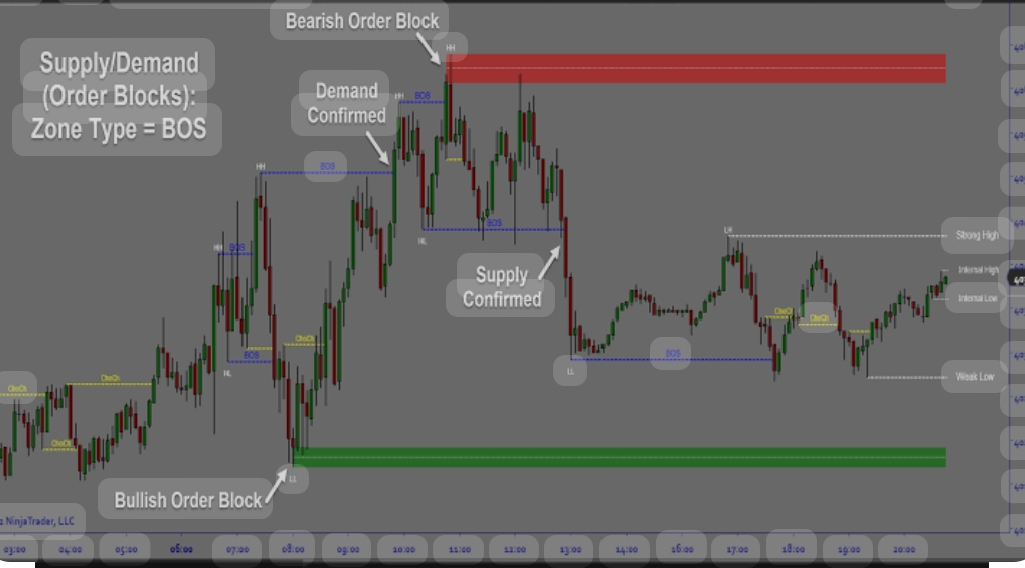
What is a Supply Zone: 

This is the area where the price has aggressive moves to the downside and it is identified by the surfacing of an up-close candle before a series of down-closed candles, this particular up-closed candle forms the supply zone, and it is said that once the price gets back to that zone it is a bearish signal to form a short bias in the market.
What is a Demand Zone: 

This is the area where the price has aggressive moves to the upside and it is identified by the surfacing of a down-closed candle before a series of up-closed candles, this particular down-closed candle forms the demand zone, and it is said that once the price gets back to that zone it is a bullish signal to form a long bias in the market.
This was the twist that Phantom Fx brought to the Supply and Demand theory and this group that calls themselves Phantom Fx identifies as smart money traders and therefore has a very large following of traders who they inspire and mentor to trade their concept.
The Inner Circle Trader (I.C.T) 

Michael J. Huddleson popularly known as I.C.T also known as “The Ghost in the Machine”
He is the founding father of what is known as the Smart Money Concept, yes you heard that right, he was the one who made the concept public in 2016 when he started his mentorship and ever since then, it spread like wildfire.
Brief history:
Michael J. Huddleson was born in 1971 and just like a lot of great men, didn’t have a rosy
Start to life as he was born with no silver spoon and had to work jobs to survive, he was a
Delivery boy at some point in his life.
To cut the long story short he started trading in 1990 over 30 years ago, and has run through
A lot of trading books which by his own words he said 90 percent were no good.
As I have said earlier, he founded the smart money concept but not like what was out there, his
The methodology focused on what he calls the Algorithm of the Market.
I.C.T Algorithmic Trading Concept: 

The concept like all other practitioners of SMC focuses heavily on the liquidity in the market and believes that the market gravitates toward areas that are considered to be liquidity, and this is the way the market works.
I.C.T brought out a lot of trading models which I won’t be able to cover in this discussion, I will dive into his most important concepts which are:
- Time and Price Theory
- Internal and External Liquidity
Time and Price Theory

I.C.T says time is the most important factor in the marketplace as the price will not move reasonably until the time of day is at a point where movement is expected, example of these times Are 2:00amEST, 3:00 am EST, 8:30amEST, and 9:30amEST. These are some of the times ICT teaches his students to focus on as they are the times when liquidity is injected into the market, hence causing predictable movements.
He has various patterns that he uses for entry, and he says although these patterns form every time and anytime, you are not supposed to trade them without putting the time of day into perspective and when you trade these patterns during those times of day mentioned above with correct bias you will be correct more often than not.
He gives a hierarchy to the things that take precedence in the market, and he outlines this hierarchy as follows:
- Time
- Price
The time comes before price.
Internal and External Liquidity
ICT believes there are areas of liquidity that price gravitates to and reacts to, these are internal and external liquidity levels.
Internal Liquidity

This is the area within a candle stick structure where there is a price gap, which he popularized as the Fair-value Gap (FVG) and this area once identified serves as a magnet to price as price is expected to go back to the area at some point in time and can cause a significant reaction.
There are two different types of FVG namely:
- Buy-side Imbalance Sell-side Inefficiency (BISI)
- Sell-side Imbalance Buy-side Inefficiency (SIBI)
The former is represented by a three-candle stick pattern whereby the top wick/shadow of the first candle stick in the series does not touch the third candle stick wick/shadow of the candle stick series thereby creating an imbalance or gap, and this a significant area for price to fill at some point in time.
The latter is represented by a three-candlestick pattern whereby the down wick/shadow of
The first candle in the series does not touch the third candle stick wick/shadow in the series
Hereby creating an imbalance or gap and this is a significant area for price to fill at some
Point in time.
Note: Because price is expected to fill these areas of imbalance, this forms the internal range
Of liquidity concept and this aids traders in picking likely directions in the market based on the
The area where the internal liquidity sits.
External Liquidity

Just like the concept of internal liquidity, the external liquidity concepts also state the fact
That price moves to areas where there is liquidity.
The places in the price chart that form the ICT external liquidity areas are as follows
- Daily lows/highs, Weekly lows/highs, Session lows/highs
- Equal lows and Equal highs
Daily lows/highs, Weekly lows/highs, Session lows/highs

As the names suggest, these are timeframes and also time of day points in the price chart, The Weekly low is mostly the low formed in the previous week and ICT says the algorithm of the market a lot often draws to these points same is also said for the Daily Lows, the session lows are the: London session, New York session, Asian session, and ICT draws his attention to these points and believes price reaches these areas for liquidity, everything said about the lows can also be said about the highs in an opposite manner.
Equal lows and Equal highs

Just as their names depict these are price points where the swing points are closely at the same level for the Equal lows ICT says when there are swing lows closely knitted at the same level, “the algorithm of the market likes to go to that area to make it Jaggard”, in the sense that it will gravitate towards it for liquidity and the same goes for Equal highs, when there are swing highs closely knitted at the same level, “the algorithm of the marketplace likes to go to that area to make it Jaggard”.
Note: In essence, price seeks liquidity, and according to ICT these are the areas where Liquidity rests.
That concludes part 2, we will be going into the war between the two concepts next week
Till then, be safe!
In this article.
Subscribe to our newsletter

Kolawole Orimoogunje
Financial Content Writer
Kolawole Orimoogunje is a seasoned financial content writer with over 6 years of experience in the financial markets as a stock analyst, investor, and forex trader. With a keen eye for market trends and a passion for simplifying complex financial concepts, Kolawole creates engaging content that informs and educates readers. His expertise allows him to deliver actionable insights tailored to diverse audiences, helping individuals and businesses make informed financial decisions.
View author profile