Website Heatmap: What It is and How to Use It in 2024
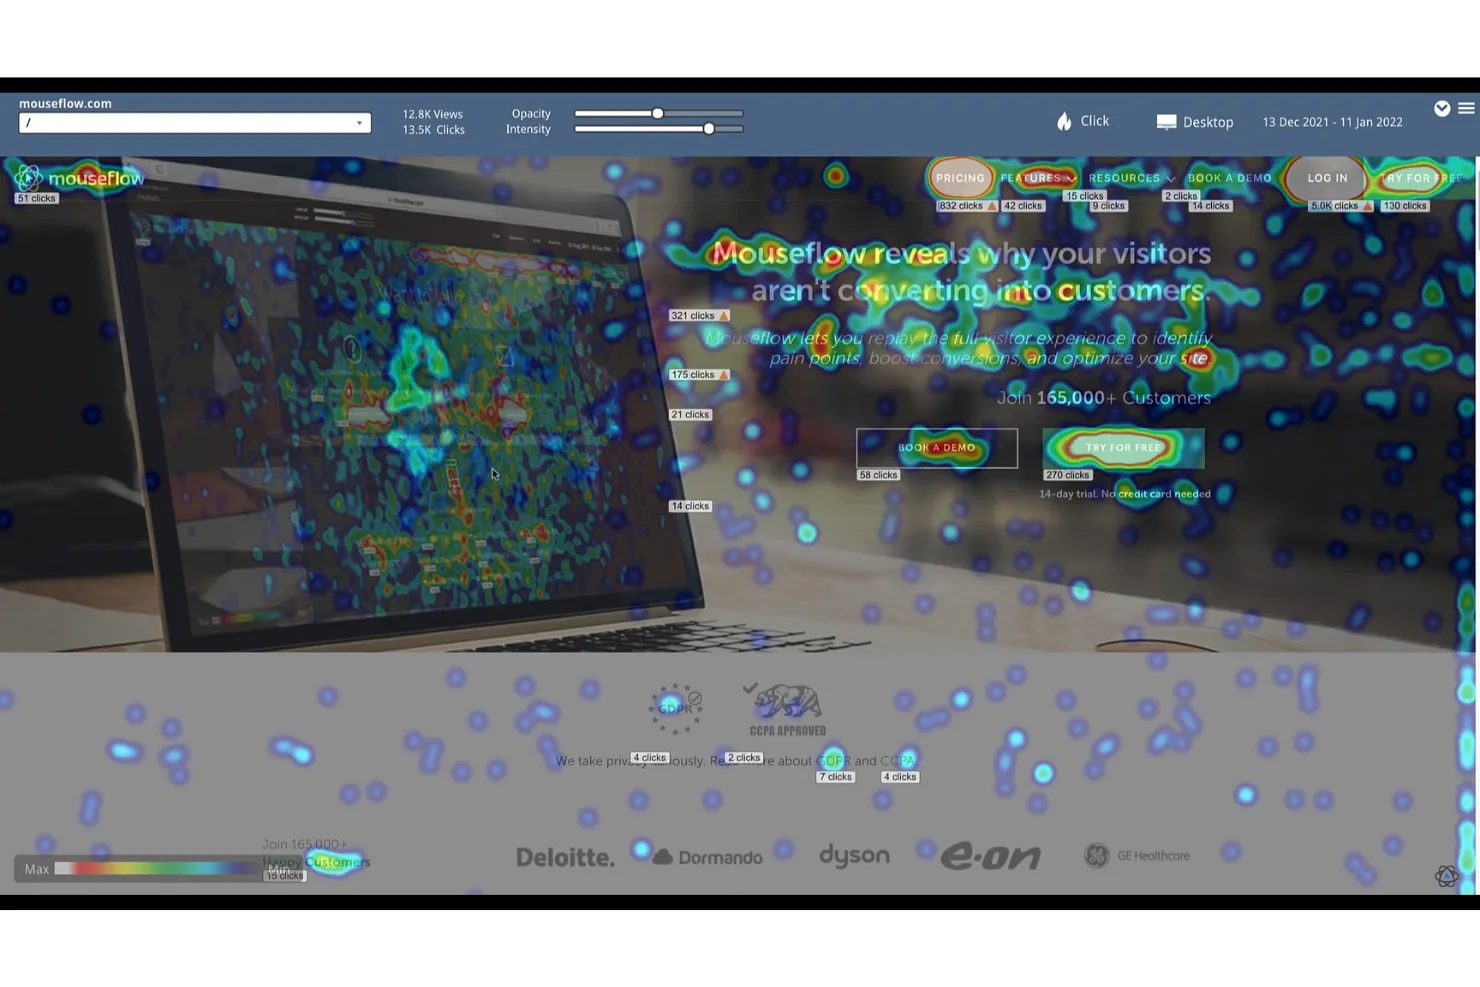
[image source: Mouseflow]
It is no news that the battle for people’s attention — your potential customers — has gotten increasingly fiercer over the years. Not surprisingly, 2024 promises to be no different. From social media to web content and traditional media, businesses must work even harder to convert visitors to paying customers and keep them. This is where innovative solutions like website heatmaps come into play.
Since many businesses rely heavily on their websites to pull potential customers into their sales funnel and trigger conversions, optimizing their customer journey as much as possible is crucial. One way to do this is by leveraging solutions that can help you read and analyze user heatmaps on your websites.
But what exactly is a website heatmap? And is it worth all the hype?
In this blog, we walk you through all the exciting details about website heatmaps, including what they are, how they work, and the various advantages they offer.
What is a Website Heatmap?
First off, a heatmap generally refers to a graphical representation of data whereby the values are represented as colors. In most cases, heatmaps usually identify trends, patterns, or magnitude of activity.
In the digital marketing world, heatmaps are an excellent way to visualize and analyze user activity on your business website.
A website heatmap uses color to represent user interactions on the specific webpage you’re analyzing, indicating metrics like the areas of the page where users click, move the cursor, or spend the most time. With heatmaps, the warmer colors, such as red and orange, typically represent areas with more interaction while cooler colors, like blue, indicate less activity.
As a business owner, heatmaps tools can provide valuable insight into your website and how it influences user behavior. You can easily pinpoint the areas on a webpage that see the most interaction and which are ignored, thereby helping you make data-driven decisions to optimize the user experience and improve conversions.
Types of Website Heatmaps
Like regular maps, there are several types of website heatmaps depending on the information they give you. Of course, each provides a unique insight into user behavior.
Here are three main types of website heatmaps:
1. Scroll Maps
Scroll maps give you a visual representation of the scrolling activity of visitors on your website or a specific web page. In other words, you can see how far visitors scroll — if they reach the bottom of the page or give up halfway.
Using the data that a scroll heatmap provides, you can get a better idea about what section of your webpage most visitors drop off. For instance, if your heatmap reports show you that 75% of your visitors only make it about 3/4 way down, then you may need to tweak something in that section to keep them scrolling.
Better still, you could move your more exciting offers or CTAs up to capture their attention and give them more to anticipate.
2. Click Maps
As the name implies, click heatmaps light up when site visitors click on icons or links on your website. In other words, the sections on your site that users click the most would be showcased as the hot zones.
The data from a click map can be critical as it helps highlight which parts of your website are not getting enough attention. This way, you can optimize these sections and improve the overall user experience on your website.
Besides, tracking user clicks can also help uncover error clicks and rage clicks that occur on your site. For instance, are there buttons or icons that look clickable but are not?
3. Mouse Tracking Maps
Mouse tracking heatmaps basically show you the mouse movements that visitors to your site make before they click, take action or even leave your website. Visualizing user mouse movement gives you an excellent perspective on how site visitors move from click to click and highlight if there were any issues along the way.
By compiling mouse tracking maps from various users, you can gain some insight into your website user experience and what you need to optimize.
How to Use Website Heatmaps in 2024
Website heatmapping can be a great way to get ahead of the competition as it can quickly highlight what works and what doesn’t on your website. Even better, heatmaps provide the data you need in simple, easy-to-understand graphical formats, enabling you to make decisions faster.
Here are some of the ways you can leverage website heatmaps for your business website this year:
Use heatmaps to understand customer behavior
There’s a ton of marketing strategy out there, with each expert claiming their method is the next best thing. While you cannot implement every strategy on all platforms, the trick is to seek out the one that works best for your customers.
But first, you need to understand your target customer behavior — enter website heatmaps.
Heatmaps are a great way to gain valuable insight into your customers by observing their behavior on your website.
- Are they looking for particular products?
- Do they have issues navigating your website?
- Do they scroll to a certain section and then exit your site?
- Are they clicking your CTAs?
Once you have an adequate amount of heatmap data, you can then begin to analyze visitor behavior and identify a pattern.
Use heatmaps to identify hotspots
PerformYard has various pricing options on its website. To access the performance management business software, pricing is $5-10 per employee per month. The company bills this annually, and minimum pricing applies. There are also enterprise pricing discounts available.
The performance management package provides features necessary to manage your performance review cycles, check-ins, feedback, and goals. You also get full customization capabilities to design the best review cycle that suits your organization. Automatic performance review data collection and full analytics and reporting capabilities are also available.
You get access to employee engagement if you pay an additional $1-3 per person/month. This add-on allows you to track and monitor employee sentiment with surveys and a visual dashboard. You can also contact a product expert to get features and custom price quotes that work for your organization.
Use heatmaps to identify exit points
Bounce rates are an essential metric to have, no doubt. But heatmaps can do you one better — they show you the approximate points at which visitors to your website decide to leave. By tracking user scrolling and mouse movements, you can see far visitors scrolling and what they do before they drop off.
Using the insights from these heatmaps, you can then work to improve your content placement, valuable offers, CTAs, and other variables that can keep users on your site for longer. Of course, longer browsing durations could generally translate to higher conversion rates and that’s where the jackpot is!
The Bottom Line
Website heatmaps offer a user-centric approach to website optimization by providing valuable insights into user behavior that can be used to enhance UX and drive conversions. Therefore, as a business owner looking to get as much ROI as you can get from your website, leveraging heatmap tools is a great way to pull ahead in 2024.
Subscribe to our newsletter
In this article.
Subscribe to our newsletter

Timilehin Adeleke
Technical SaaS Writer | Product Marketer
Tim Adeleke is a powerhouse technical writer transforming complex technical concepts into sharp, user-friendly content that resonates with business audiences. With nearly a decade of experience writing for global SaaS and B2B tech brands, he brings crystal clarity, structure, and a laser focus on the user to every piece he crafts.
View author profile